Numpy で動画の背景を取得する
其ノ壱 :
  フレームの平均値を取ってみる。
  フレームを足してフレーム数で割る。雑。
  サンプルは OpenCV 付属の vtest.avi

  少し残像が残るが、そこそこな感が。
#coding:utf-8
import numpy as np
import cv2

def mean():
    FileName = r'OpenCV/samples/data/vtest.avi'

    cap= cv2.VideoCapture(FileName)     # (576, 768, 3) 795frame
    FrameCount = int(cap.get(cv2.CAP_PROP_FRAME_COUNT))
    ret, frame = cap.read()
    img = np.zeros_like(frame, dtype='int32')
    i = 0
    while True:
        img += frame
        i += 1

        temp_img = np.uint8(img // i)
        cv2.putText(temp_img, str(i) + ' / ' + str(FrameCount),
                (10, 30), cv2.FONT_HERSHEY_SIMPLEX, 1.0, (0, 255, 0), thickness=2)
        cv2.imshow('image', temp_img)
        if cv2.waitKey(1) > 8:      # どれかキーを押せば終了
            break

        ret, frame = cap.read()
        if ret != 1:
            break

    cv2.destroyAllWindows()
    return 1

if __name__ == '__main__':
    mean()
其ノ弐 :
  色を分割して蓄積し、最頻出の部分だけ再構築してみる。
  今回は四分割。
  300フレーム辺りで、ほぼ背景のみに。
  但し重い。

#coding:utf-8
import numpy as np
import cv2

def index():
    n = 4	# 四分割
    FileName = r'OpenCV/samples/data/vtest.avi'

    cap= cv2.VideoCapture(FileName)     # (576, 768, 3) 795frame
    FrameCount = np.int(cap.get(cv2.CAP_PROP_FRAME_COUNT))
    ret, frame = cap.read()
    Height, Width, Colors = frame.shape
    p = np.arange(frame.size)
    temp_img = np.zeros(Height * Width * Colors * n * 2, dtype='uint32')
    temp_img.shape = -1, n, 2   # (1327104, 4, 2)

    i = 0
    while True:
        frame.shape = -1        # (1327104,)
        a = frame // (256 // n)
        temp_img[p,a,0] += frame[p]
        temp_img[p,a,1] += 1
        i += 1

        q = np.argmax(temp_img[:,:,1],axis=1)
        temp_img2 = temp_img[p,q]
        img = temp_img2[:,0] // temp_img2[:,1]
        img.shape = Height, Width, Colors
        img = img.astype('uint8')

        cv2.putText(img, str(i) + ' / ' + str(FrameCount),
                (10, 30), cv2.FONT_HERSHEY_SIMPLEX, 1.0, (0, 255, 0), thickness=2)
        cv2.imshow('image', img)
        if cv2.waitKey(1) > 8:      # どれかキーを押せば終了
            break

        ret, frame = cap.read()
        if ret != 1:
            break

    cv2.destroyAllWindows()
    return 1

if __name__ == '__main__':
    index()
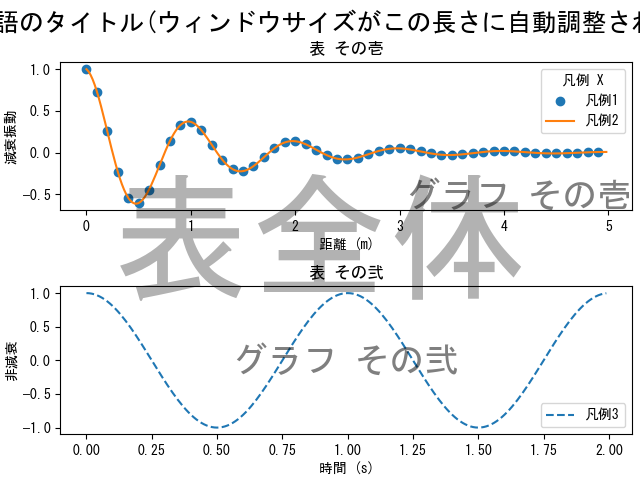
Matplotlib で日本語を表示する
環境 : Windows10

Matplotlib で検索できるフォントは拡張子 '.ttf' のみ。
Windows10 の日本語フォントで拡張子 '.ttf' なのは(多分)游明朝だけ。
なので、

import matplotlib.pyplot as plt
plt.rcParams['font.sans-serif'] = 'Yu Mincho' # 游明朝

とすれば日本語が表示できる。
拡張子 '.ttc' でも、 '.ttf' にリネームすれば使える。
今回の対象 : msgothic.ttc

import matplotlib.pyplot as plt
f = r'C:\Windows\Fonts\msgothic.ttf'  # 拡張子を .ttf にしてコピーしておく
print(plt.matplotlib.font_manager.FontProperties(fname = f).get_name()) # フォント名を取得
>>> MS Gothic
plt.matplotlib.font_manager._rebuild() # キャッシュの再構築(毎回行う必要は無い)

下記URIのサンプルを改変してみる。
https://matplotlib.org/gallery/subplots_axes_and_figures/figure_title.html
#coding:utf-8
import matplotlib.pyplot as plt
import numpy as np

plt.rcParams['font.sans-serif'] = 'MS Gothic' # MS ゴシック
plt.rcParams['toolbar'] = 'None'              # ついでにツールバーも消す

def f(t):
    s1 = np.cos(2*np.pi*t)
    e1 = np.exp(-t)
    return s1 * e1

t1 = np.arange(0.0, 5.0, 0.1)
t2 = np.arange(0.0, 5.0, 0.02)
t3 = np.arange(0.0, 2.0, 0.01)

fig, axs = plt.subplots(2, 1, constrained_layout=True)
fig.canvas.set_window_title('ウィンドウ タイトル')
fig.suptitle('~~とても長い、日本語のタイトル(ウィンドウサイズがこの長さに自動調整されたりはしない。)~~', fontsize=18)
fig.text(0.5, 0.5, '表全体', alpha=0.3, size=100, ha='center', va='center', transform=fig.transFigure)

axs[0].plot(t1, f(t1), 'o', t2, f(t2), '-')
axs[0].set_title('表 その壱')
axs[0].set_xlabel('距離 (m)')
axs[0].set_ylabel('減衰振動')
axs[0].legend(('凡例1','凡例2'), title='凡例 X')
axs[0].text(1.0, 0.0, 'グラフ その壱', alpha=0.5, size=25, ha='right', va='bottom', transform=axs[0].transAxes)

axs[1].plot(t3, np.cos(2*np.pi*t3), '--', label = '凡例3')
axs[1].set_xlabel('時間 (s)')
axs[1].set_title('表 その弐')
axs[1].set_ylabel('非減衰')
axs[1].legend(loc = 'lower right')
axs[1].text(0.5, 0.5, 'グラフ その弐', alpha=0.5, size=25, ha='center', va='center', transform=axs[1].transAxes)

plt.show()
